Vector Tile API
If you've decided to use vector tiles in your map projects, you've come to the right place. Here you will learn how to easily implement vector tiles using the most popular libraries like Maplibre and OpenLayers.
Styles
With our vector tile service, you have the ability to choose styles ready for different use cases, thus greatly improving the visual appeal as well as the user experience of your users.
The table below shows the current list of styles and their IDs.
| Style name | Style ID |
| CZE basic | cze-basic |
| CZE faded | cze-faded |
| CZE grayscale | cze-grayscale |
| CZE-SVK basic | cze-svk-basic |
Style type
- style-xyz
- Uses xyz vector tiles in .pbf format
Style URL
The URL style structure looks like this:
https://api.ceda.cz/vmt/styles/{style-id}/{style-type}?token={your token}
Atribution
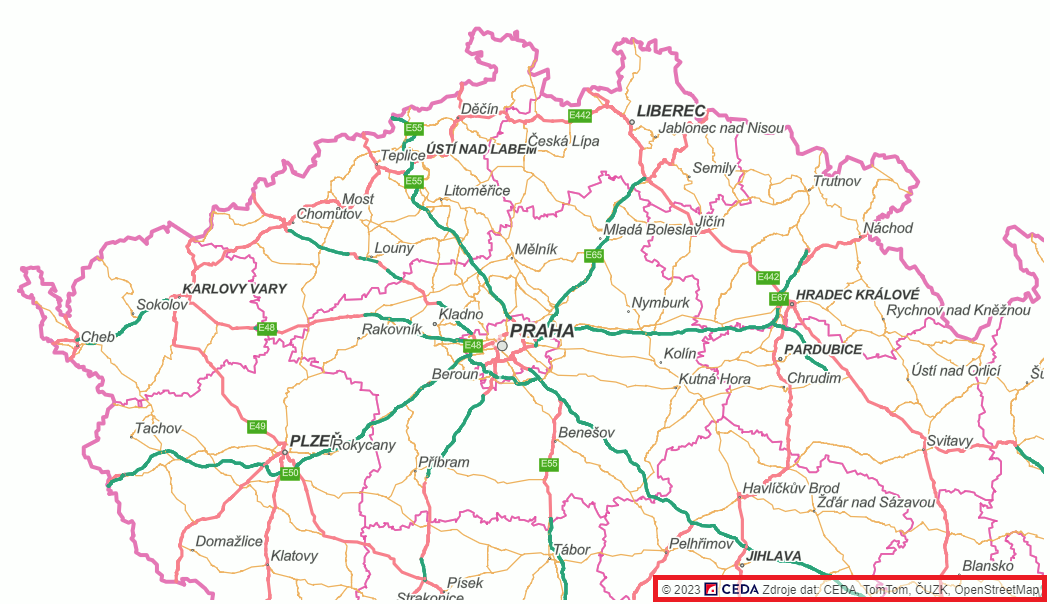
Attribution is copyright information that must be included on every map using map styles and data from CEDA Maps a.s. It is usually located in the bottom right corner of the map (see image). For some map libraries the attribution must be added manually. See below for instructions on how to do this.
OpenLayers
var layer = new ol.layer.Tile({
source: new ol.source.TileJSON({
attributions: [new ol.Attribution({
html: "<a href="https://www.ceda.cz/" target="_blank" title="CEDA" aria-label="CEDA" role="listitem">© 2023 <img style="top: 2px; position: relative;" height="14px" src="https://www.ceda.cz/fileadmin/themes/default/img/logo/CEDA_Logo_zakladni_varianta.svg"></a> <a href="https://www.ceda.cz/licencni-podminky/copyright-ceda" target="_blank">Zdroje dat: CEDA, TomTom, ČUZK, OpenStreetMap</a>"
})]
})
});
Leaflet
var attribution = L.control.attribution().addTo(map);
attribution.addAttribution('<a href="https://www.ceda.cz/" target="_blank" title="CEDA" aria-label="CEDA" role="listitem">© 2023  <img style="top: 2px; position: relative;" height="14px" src="https://www.ceda.cz/fileadmin/themes/default/img/logo/CEDA_Logo_zakladni_varianta.svg"></a>  <a href="https://www.ceda.cz/licencni-podminky/copyright-ceda" target="_blank">Zdroje dat: CEDA, TomTom, ČUZK, OpenStreetMap</a>');
Rendering a map in Maplibre GL
Rendering maps using the Maplibre GL library provides an easy and efficient way to create interactive maps. This library can be easily implemented in projects to take advantage of its features to create attractive and functional maps.
Example of xyz tiles implementation
<html>

<head>
    <script src='https://unpkg.com/maplibre-gl@2.4.0/dist/maplibre-gl.js'></script>
    <link href='https://unpkg.com/maplibre-gl@2.4.0/dist/maplibre-gl.css' rel='stylesheet' />
    <style>
        #map {
            width: 100%;
            height: 100%;
        }
    </style>
</head>

<body>
    <div id="map"></div>
    <script>

        var map = new maplibregl.Map({
            container: 'map',
            style: 'https://api.ceda.cz/vmt/styles/cze-svk-basic/style-xyz?token=VAS_TOKEN',
            center: [14.25, 50.1],
            zoom: 12
        });

    </script>
</body>

</html>
Rendering a map in OpenLayers
Using OpenLayers to display vector map data.
Example implementation
1) Javascript code sample for creating a simple map
import 'ol/ol.css';
import FullScreen from 'ol/control/FullScreen';
import olms from 'ol-mapbox-style';

olms(
  'map',
  'https://api.ceda.cz/vmt/styles/cze-svk-basic/style-xyz?token=VAS_TOKEN'
).then(function (map) {
  map.addControl(new FullScreen());
});
2) Code sample for index.html file
<!DOCTYPE html>
<html lang="en">
  <head>
    <meta charset="UTF-8">
    <title>Vector tiles created from a Mapbox Style object</title>
    <!-- Pointer events polyfill for old browsers, see https://caniuse.com/#feat=pointer -->
    <script src="https://unpkg.com/elm-pep@1.0.6/dist/elm-pep.js"></script>
    <!-- The lines below are only needed for old environments like Internet Explorer and Android 4.x -->
    <script src="https://cdn.polyfill.io/v3/polyfill.min.js?features=fetch,requestAnimationFrame,Element.prototype.classList,TextDecoder"></script>
    <script src="https://cdnjs.cloudflare.com/ajax/libs/core-js/3.18.3/minified.js"></script>
    <style>
      .map {
        width: 100%;
        height:400px;
      }
      .map .ol-rotate {
        left: .5em;
        bottom: .5em;
        top: auto;
        right: auto;
      }
      .map:-webkit-full-screen {
        height: 100%;
        margin: 0;
      }
      .map:-ms-fullscreen {
        height: 100%;
      }
      .map:fullscreen {
        height: 100%;
      }    </style>
  </head>
  <body>
    <div id="map" class="map"></div>
    <script src="main.js"></script>
  </body>
</html>
3) Sample package.json file
{
  "name": "project-name",
  "dependencies": {
    "ol": "7.2.2",
    "ol-mapbox-style": "^9.2.0"
  },
  "devDependencies": {
    "vite": "^3.2.3"
  },
  "scripts": {
    "start": "vite",
    "build": "vite build"
  }
}
Rendering a map in Leaflet
For the Leaflet library, you must use the leaflet-maplibre-gl.js plugin or the leaflet-mapbox-gl.js plugin.
<!DOCTYPE html>
<html>
<head>
  <meta charset="utf-8">
  <link rel="stylesheet" href="https://unpkg.com/leaflet@1.9.2/dist/leaflet.css" />
  <script src="https://unpkg.com/leaflet@1.9.2/dist/leaflet.js"></script>

  <!-- Add maplibre-gl-js -->
  <link href='https://unpkg.com/maplibre-gl@2.4.0/dist/maplibre-gl.css' rel='stylesheet' />
  <script src='https://unpkg.com/maplibre-gl@2.4.0/dist/maplibre-gl.js'></script>

  <!-- Add maplibre-gl-leaflet -->
  <script src="https://unpkg.com/@maplibre/maplibre-gl-leaflet@0.0.17/leaflet-maplibre-gl.js"></script>
  <style>
    html, body, #map {
      width: 100%;
      height: 100%;
      margin: 0;
    }
  </style>
</head>
<body>
  <div id="map"></div>
  <script>
    const map = L.map('map').setView([49.8025412, 15.4907228], 8);
    // Don't forget to replace <token> by your real access token!
    var gl = L.maplibreGL({
      style: 'https://api.ceda.cz/vmt/styles/cze-svk-basic-sync/style-xyz?token=<token>'
    }).addTo(map);
  </script>
</body>
</html>